ACL Essex - Infographics
ACL Essex - Infographics
2025
2025
Graphic Design, Data Visualisation, Data Organisation & Sorting.
Infographics for Strategic Intent Document for ACL Essex.
Graphic Design, Data Visualisation, Data Organisation & Sorting.
Infographics for Strategic Intent Document for ACL Essex.
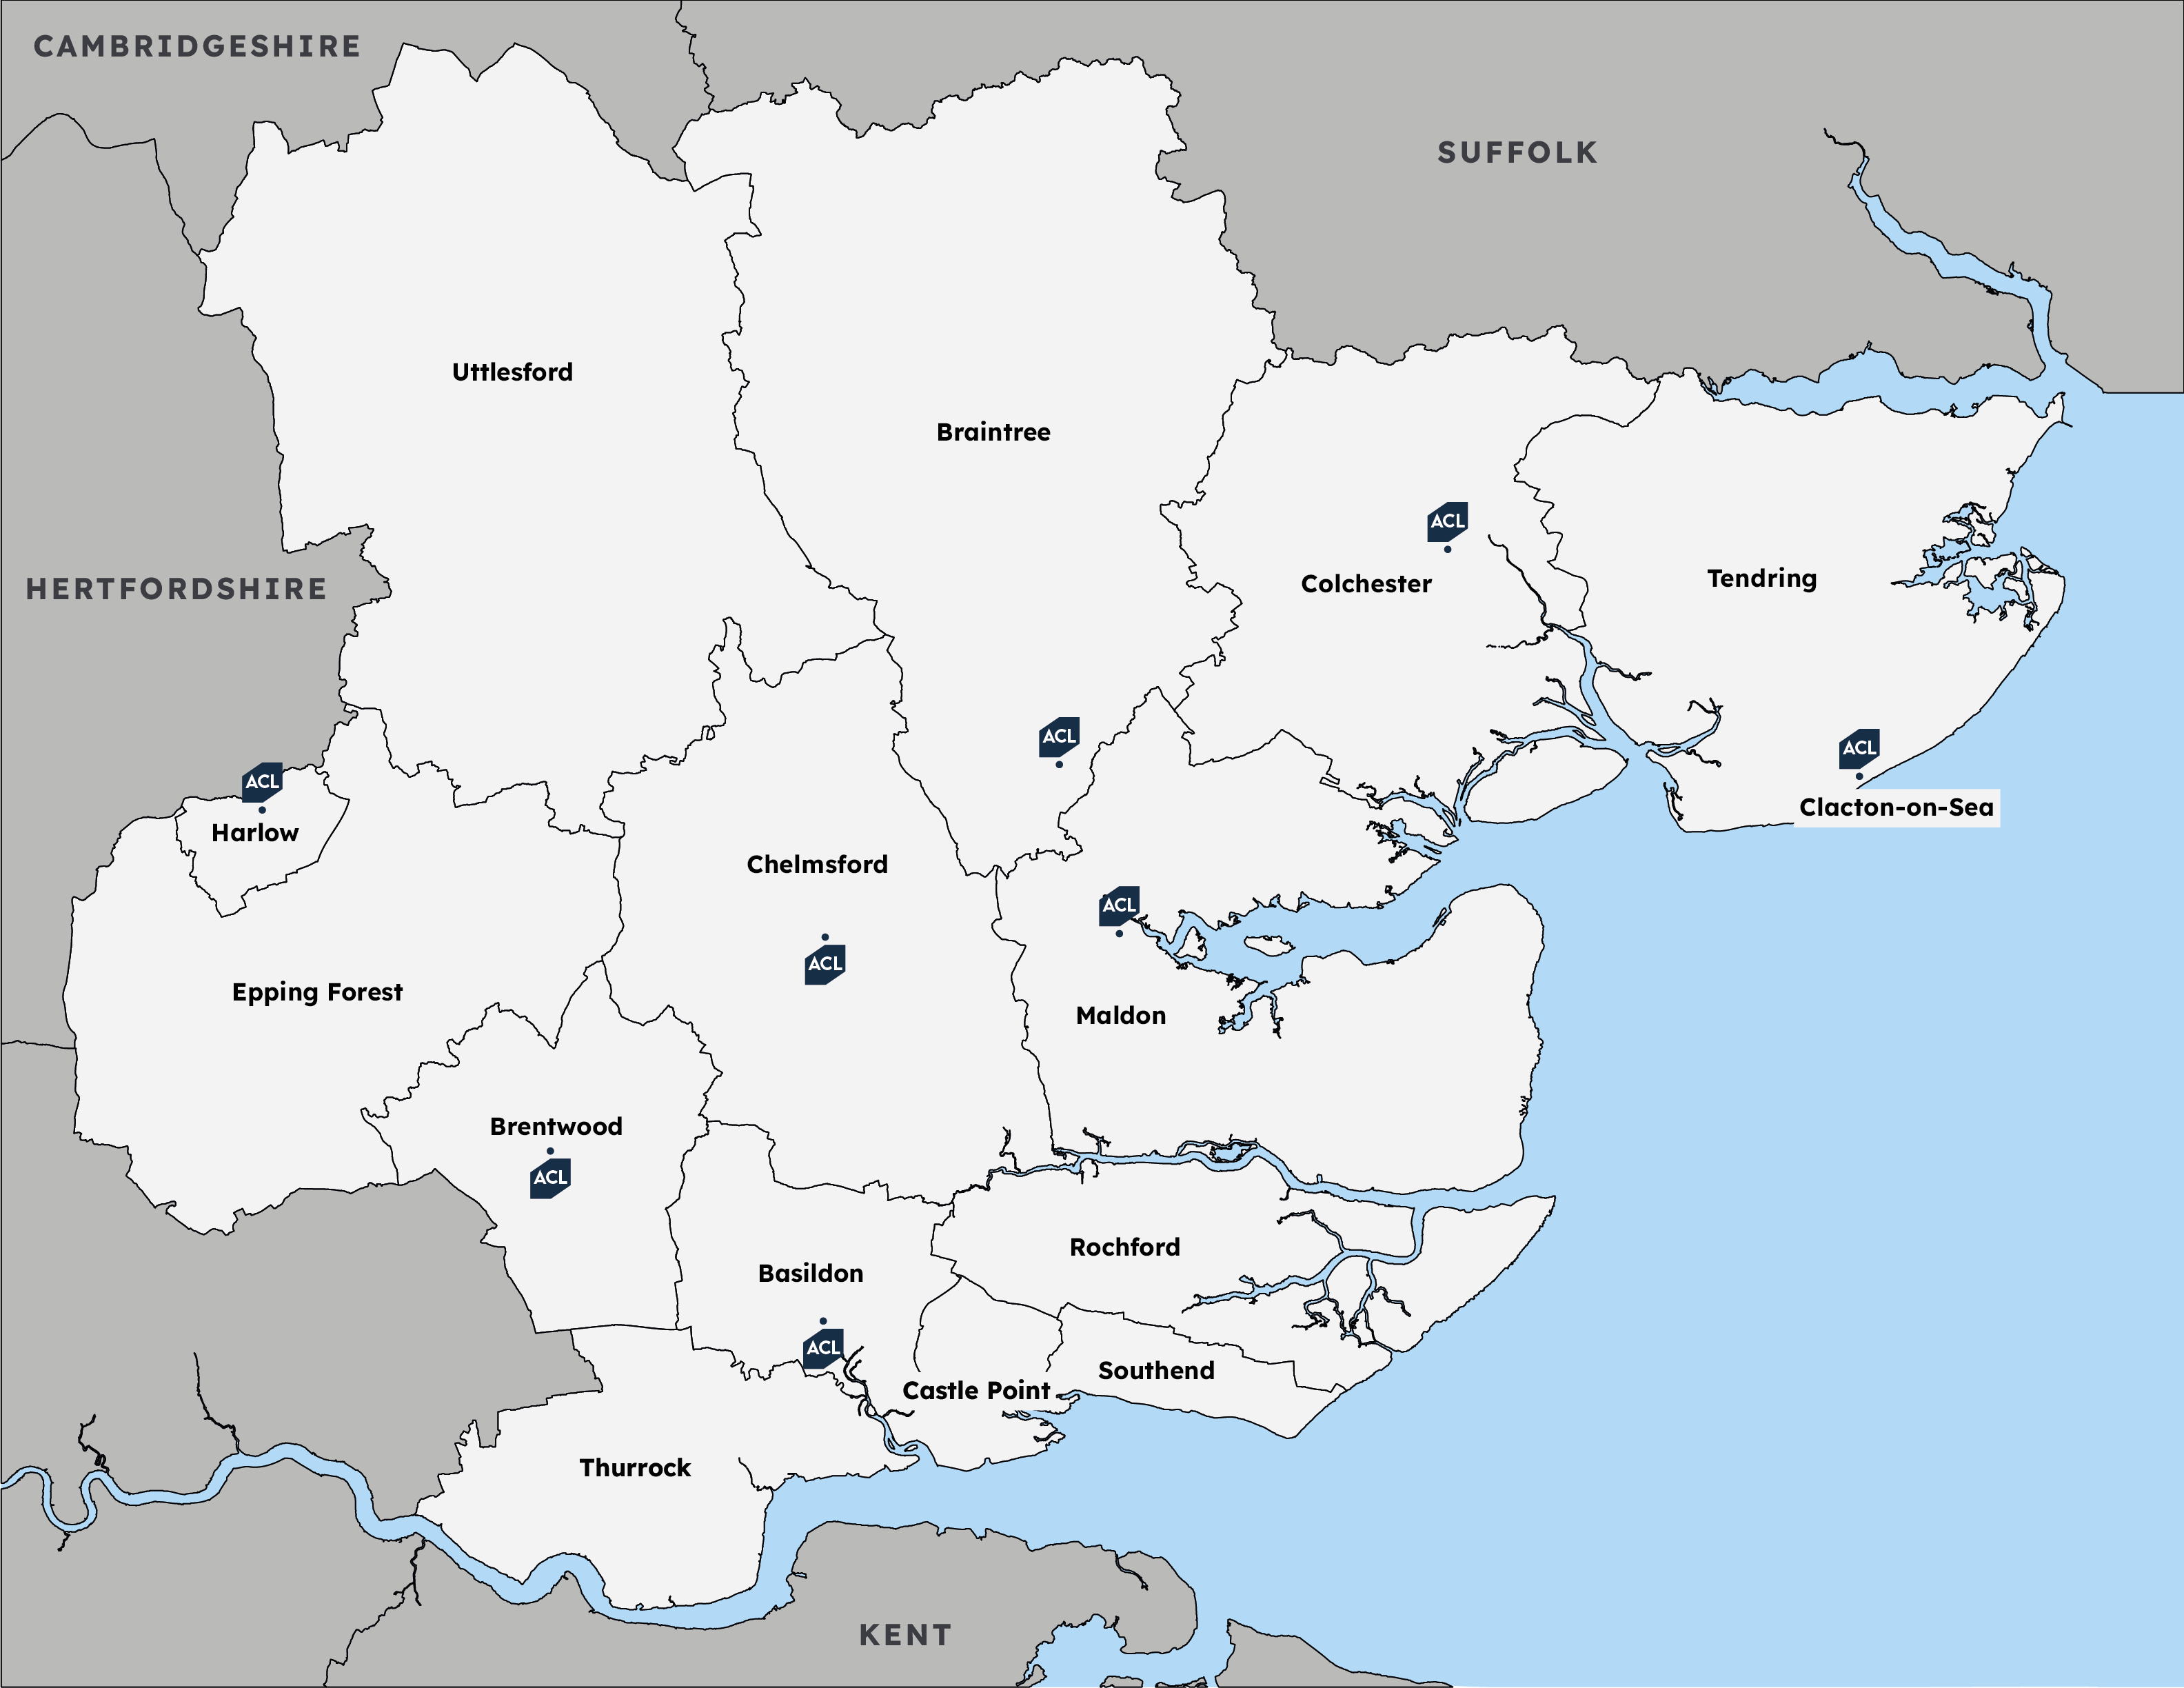
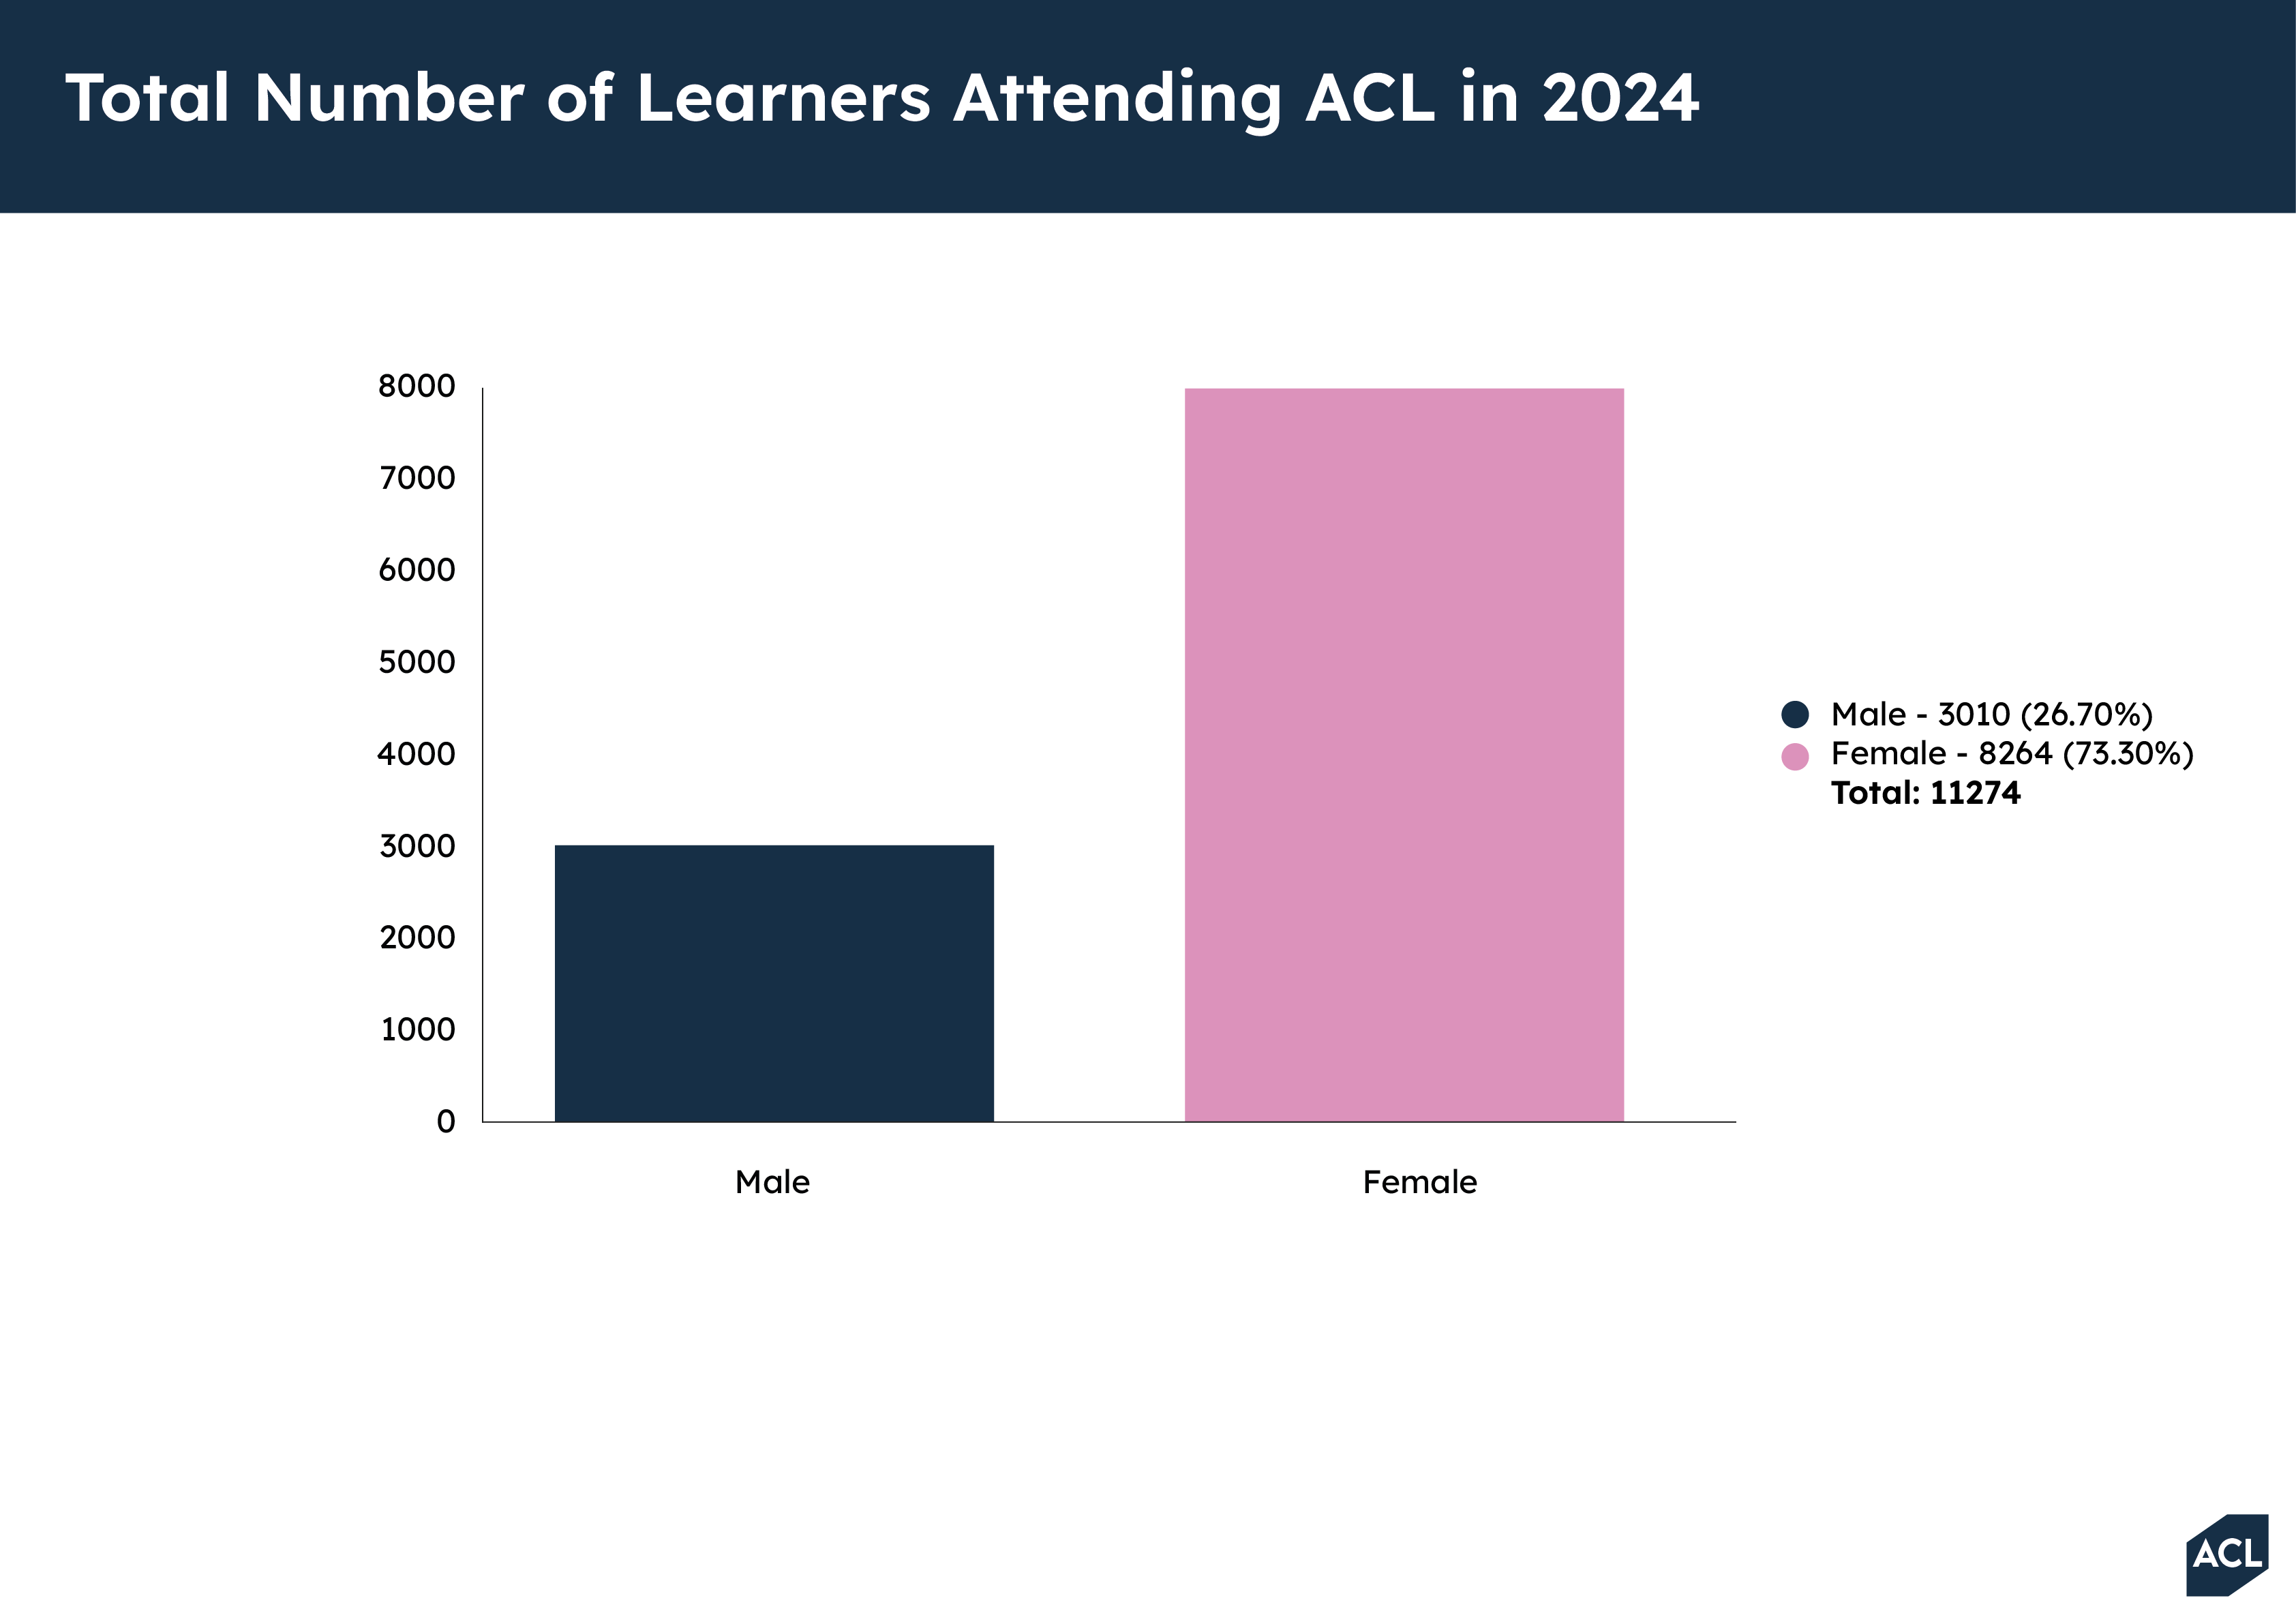
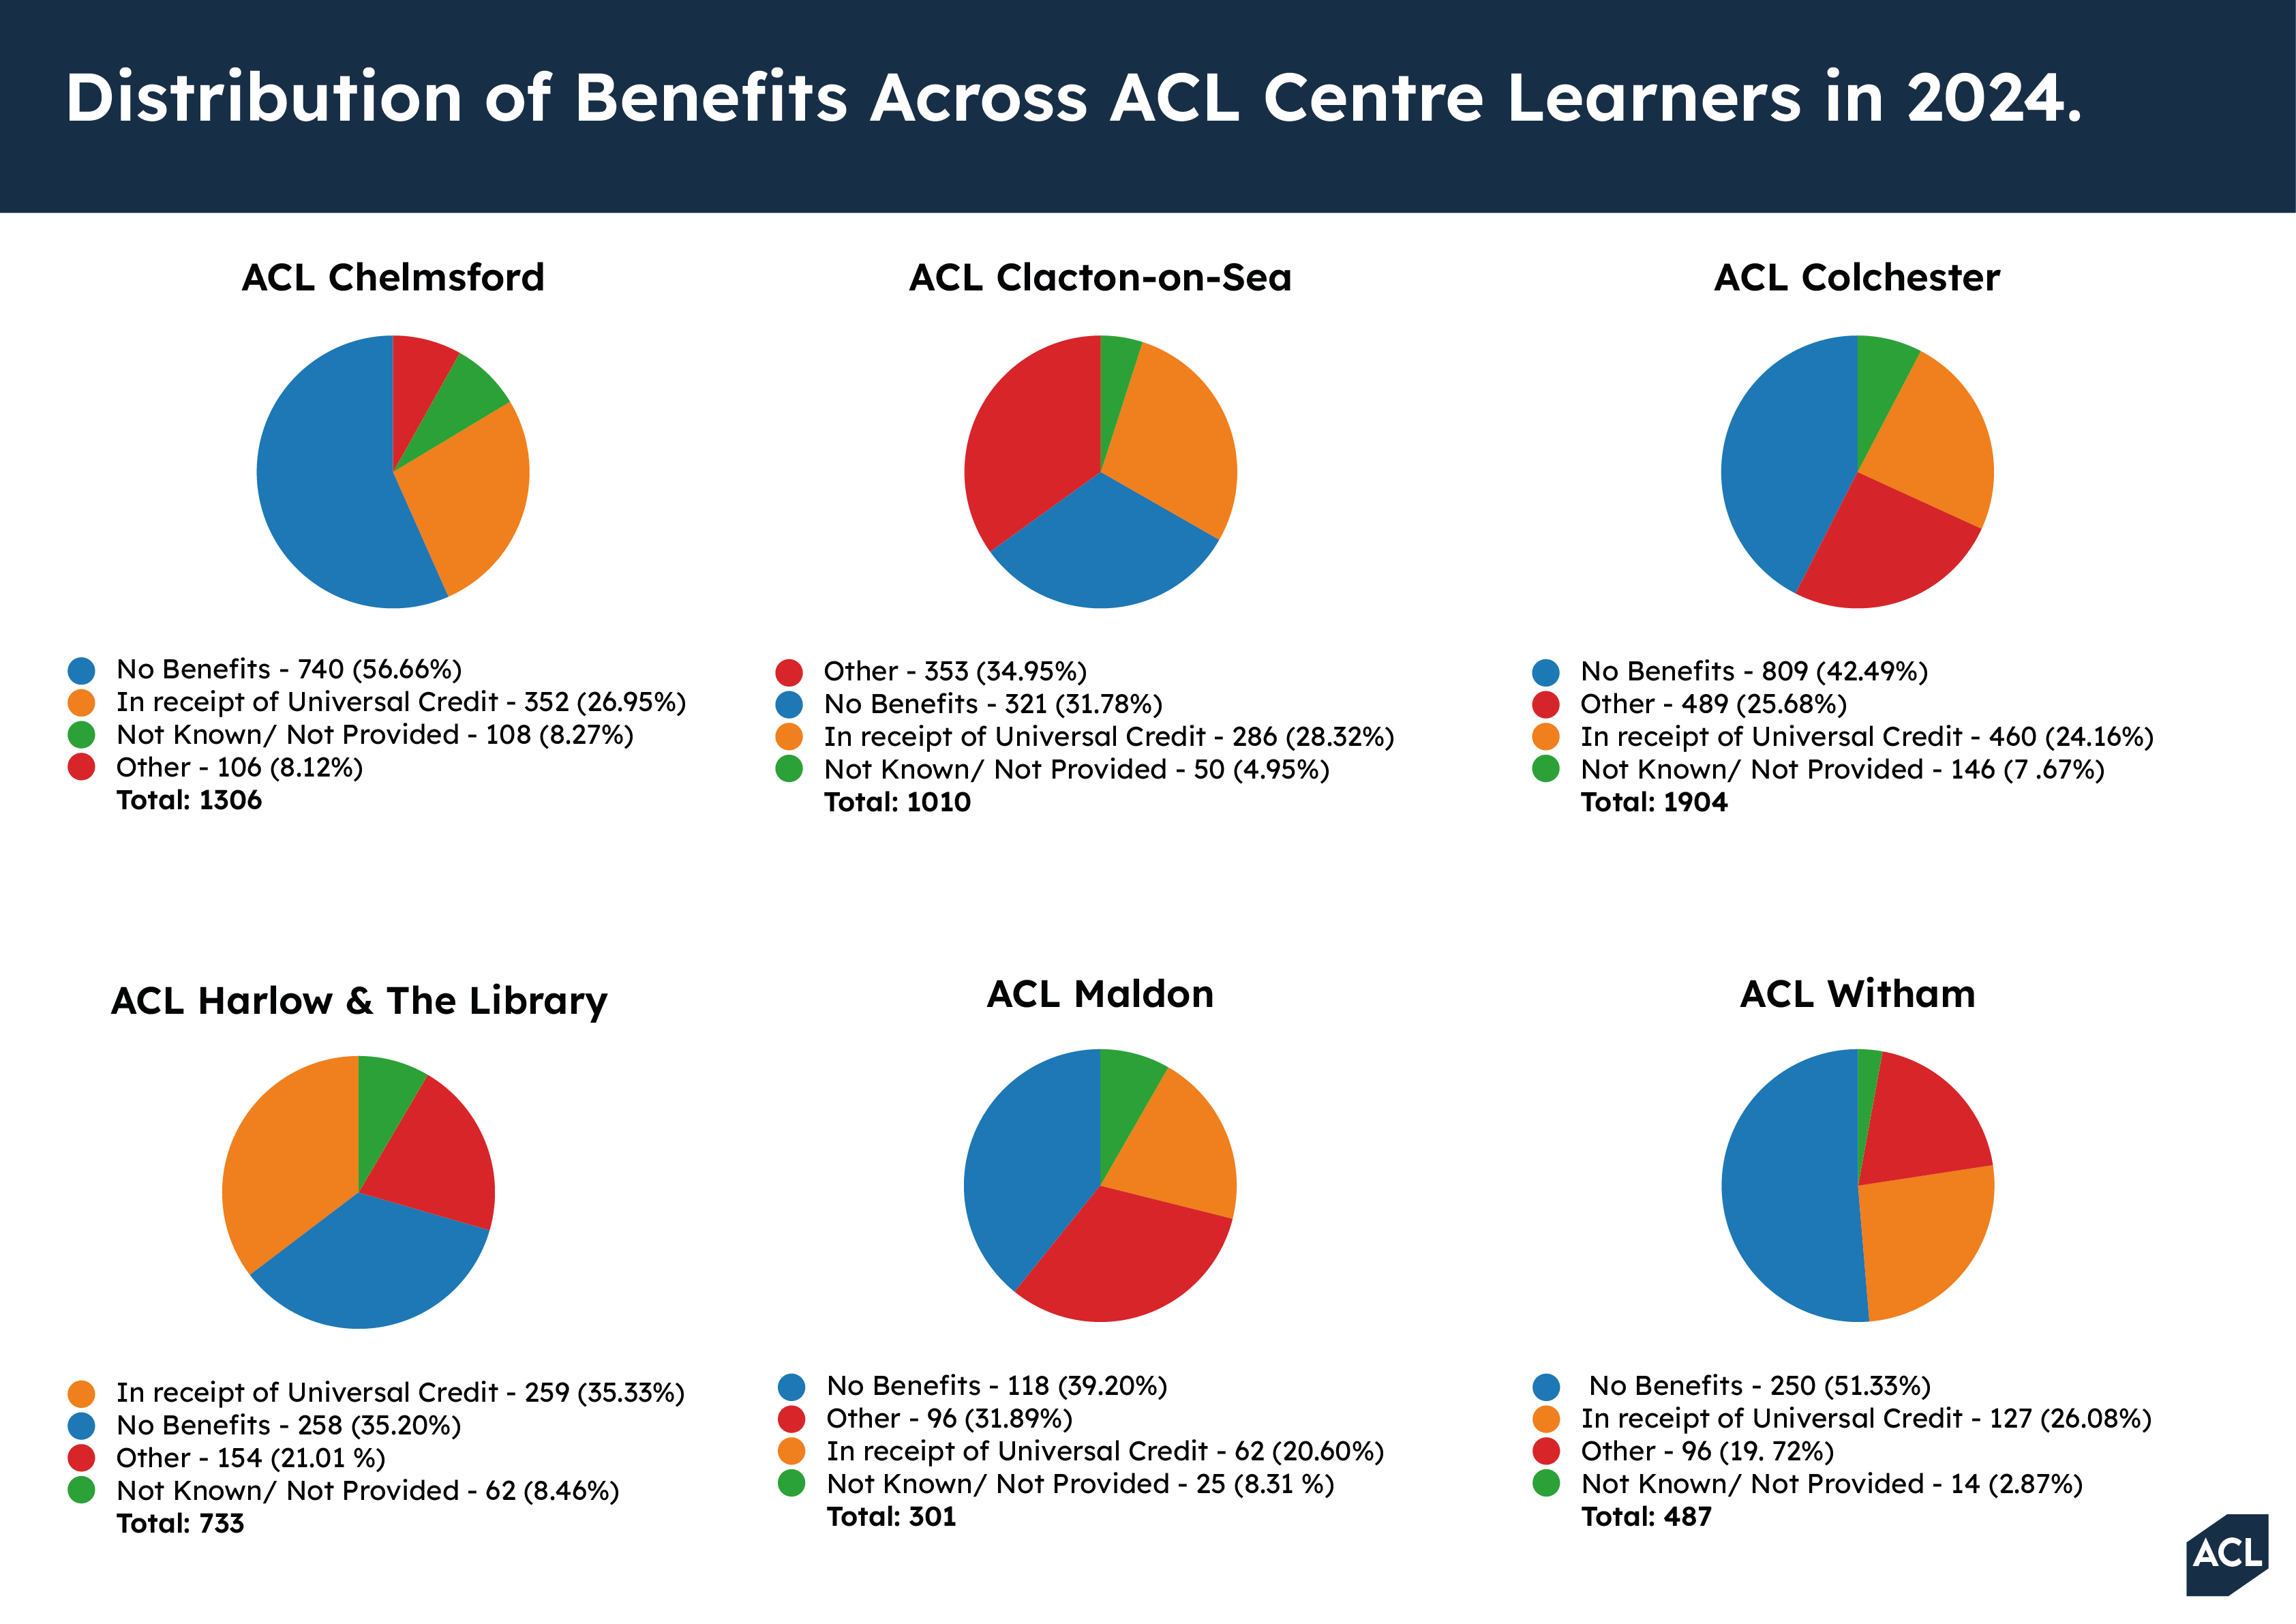
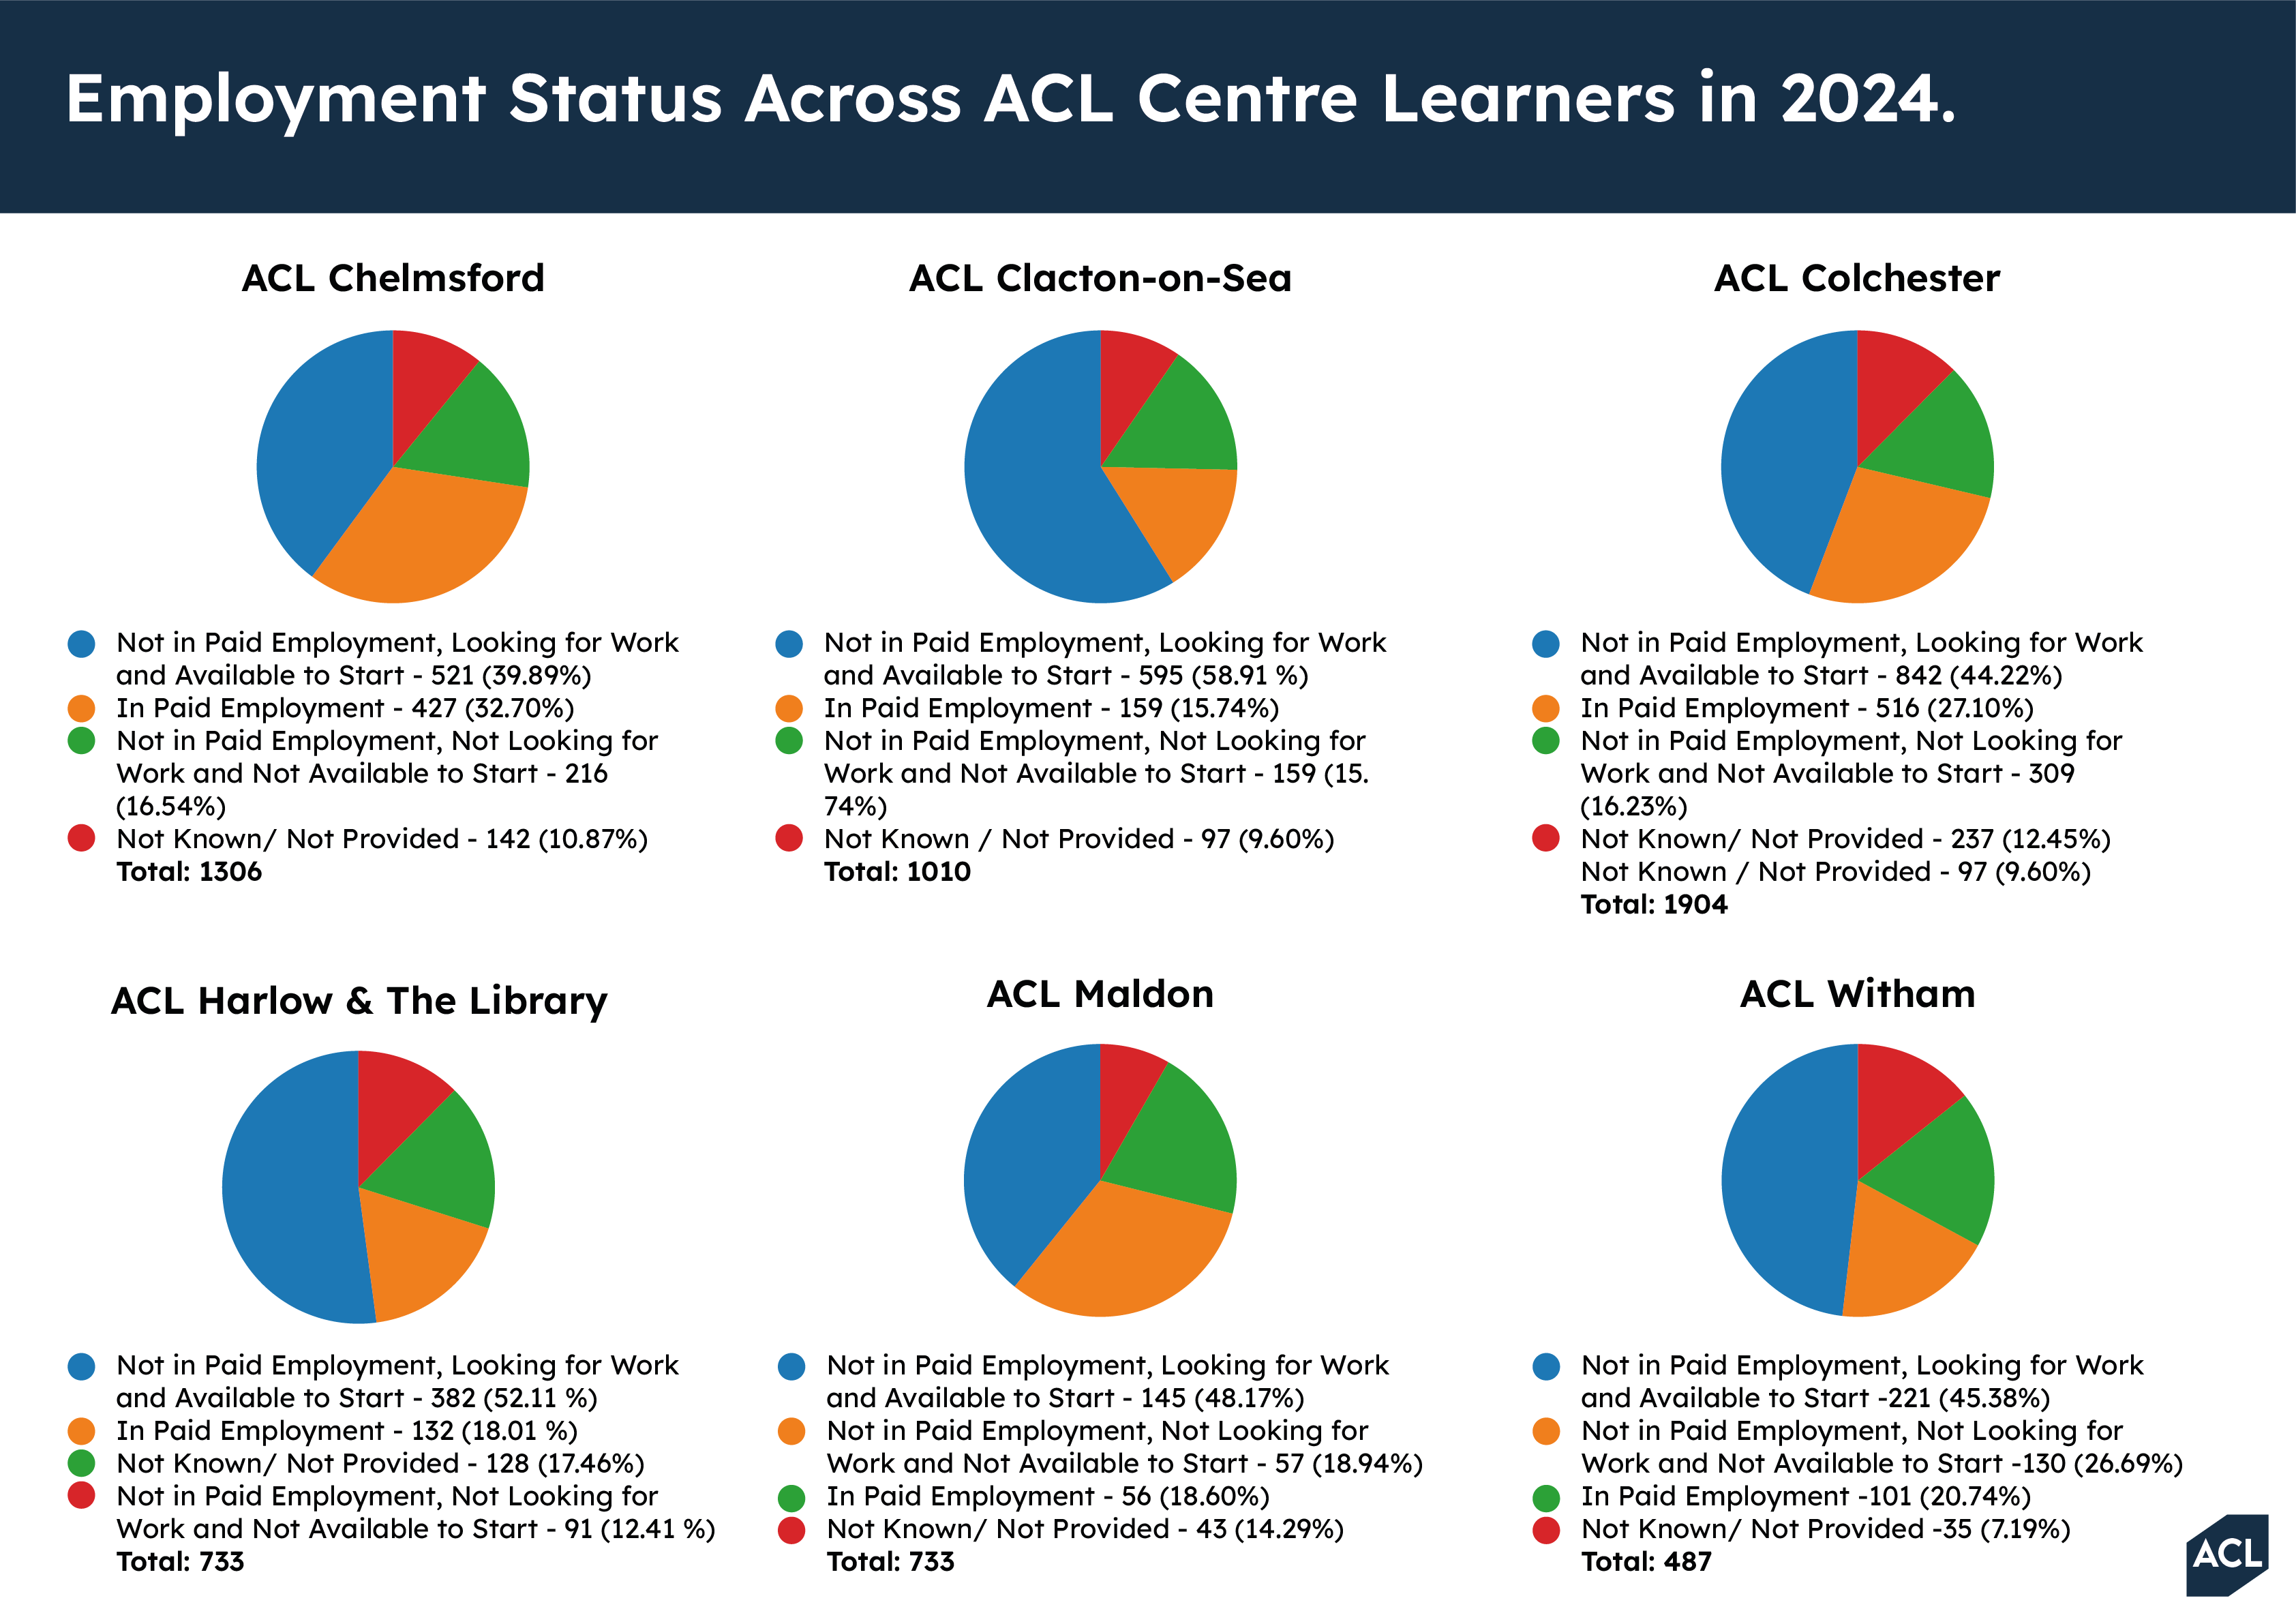
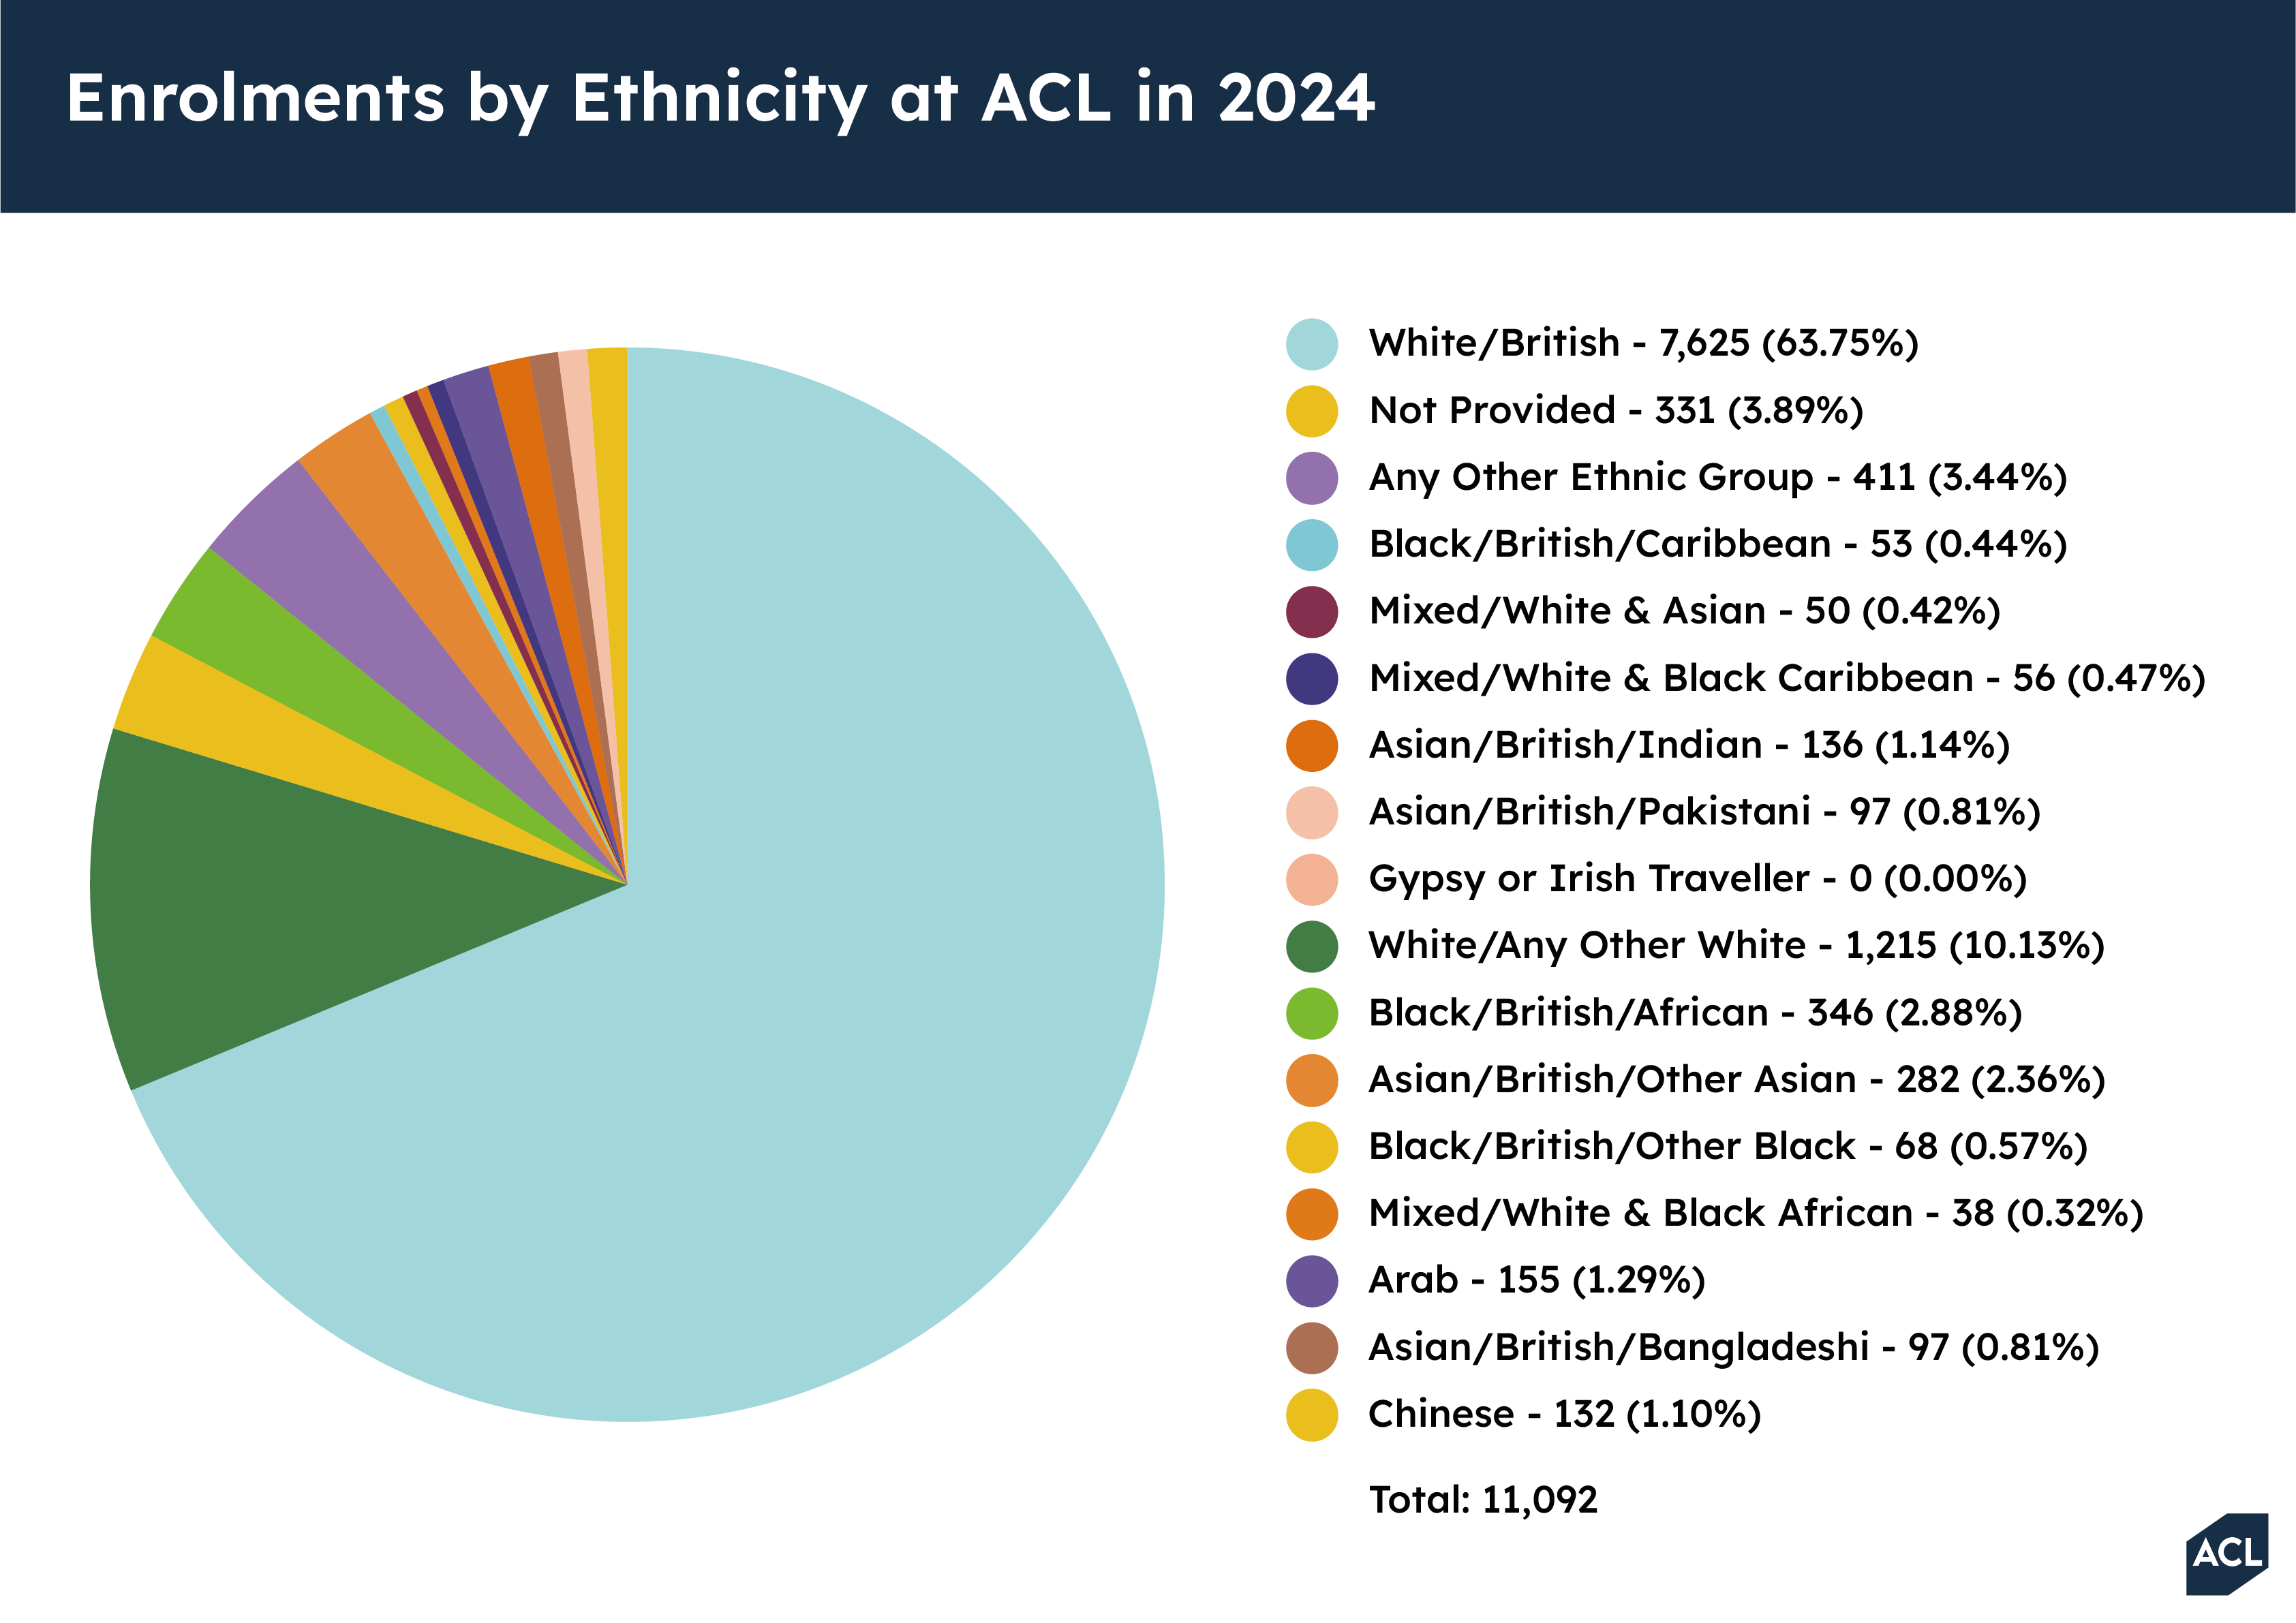
I was commissioned to design a series of infographics for ACL Essex, aimed at presenting key learner data across multiple delivery centres in a clear and accessible format. The work involved visualising complex internal data sets relating to benefit status, employment status, ethnicity, and geographic distribution of learners during 2024.
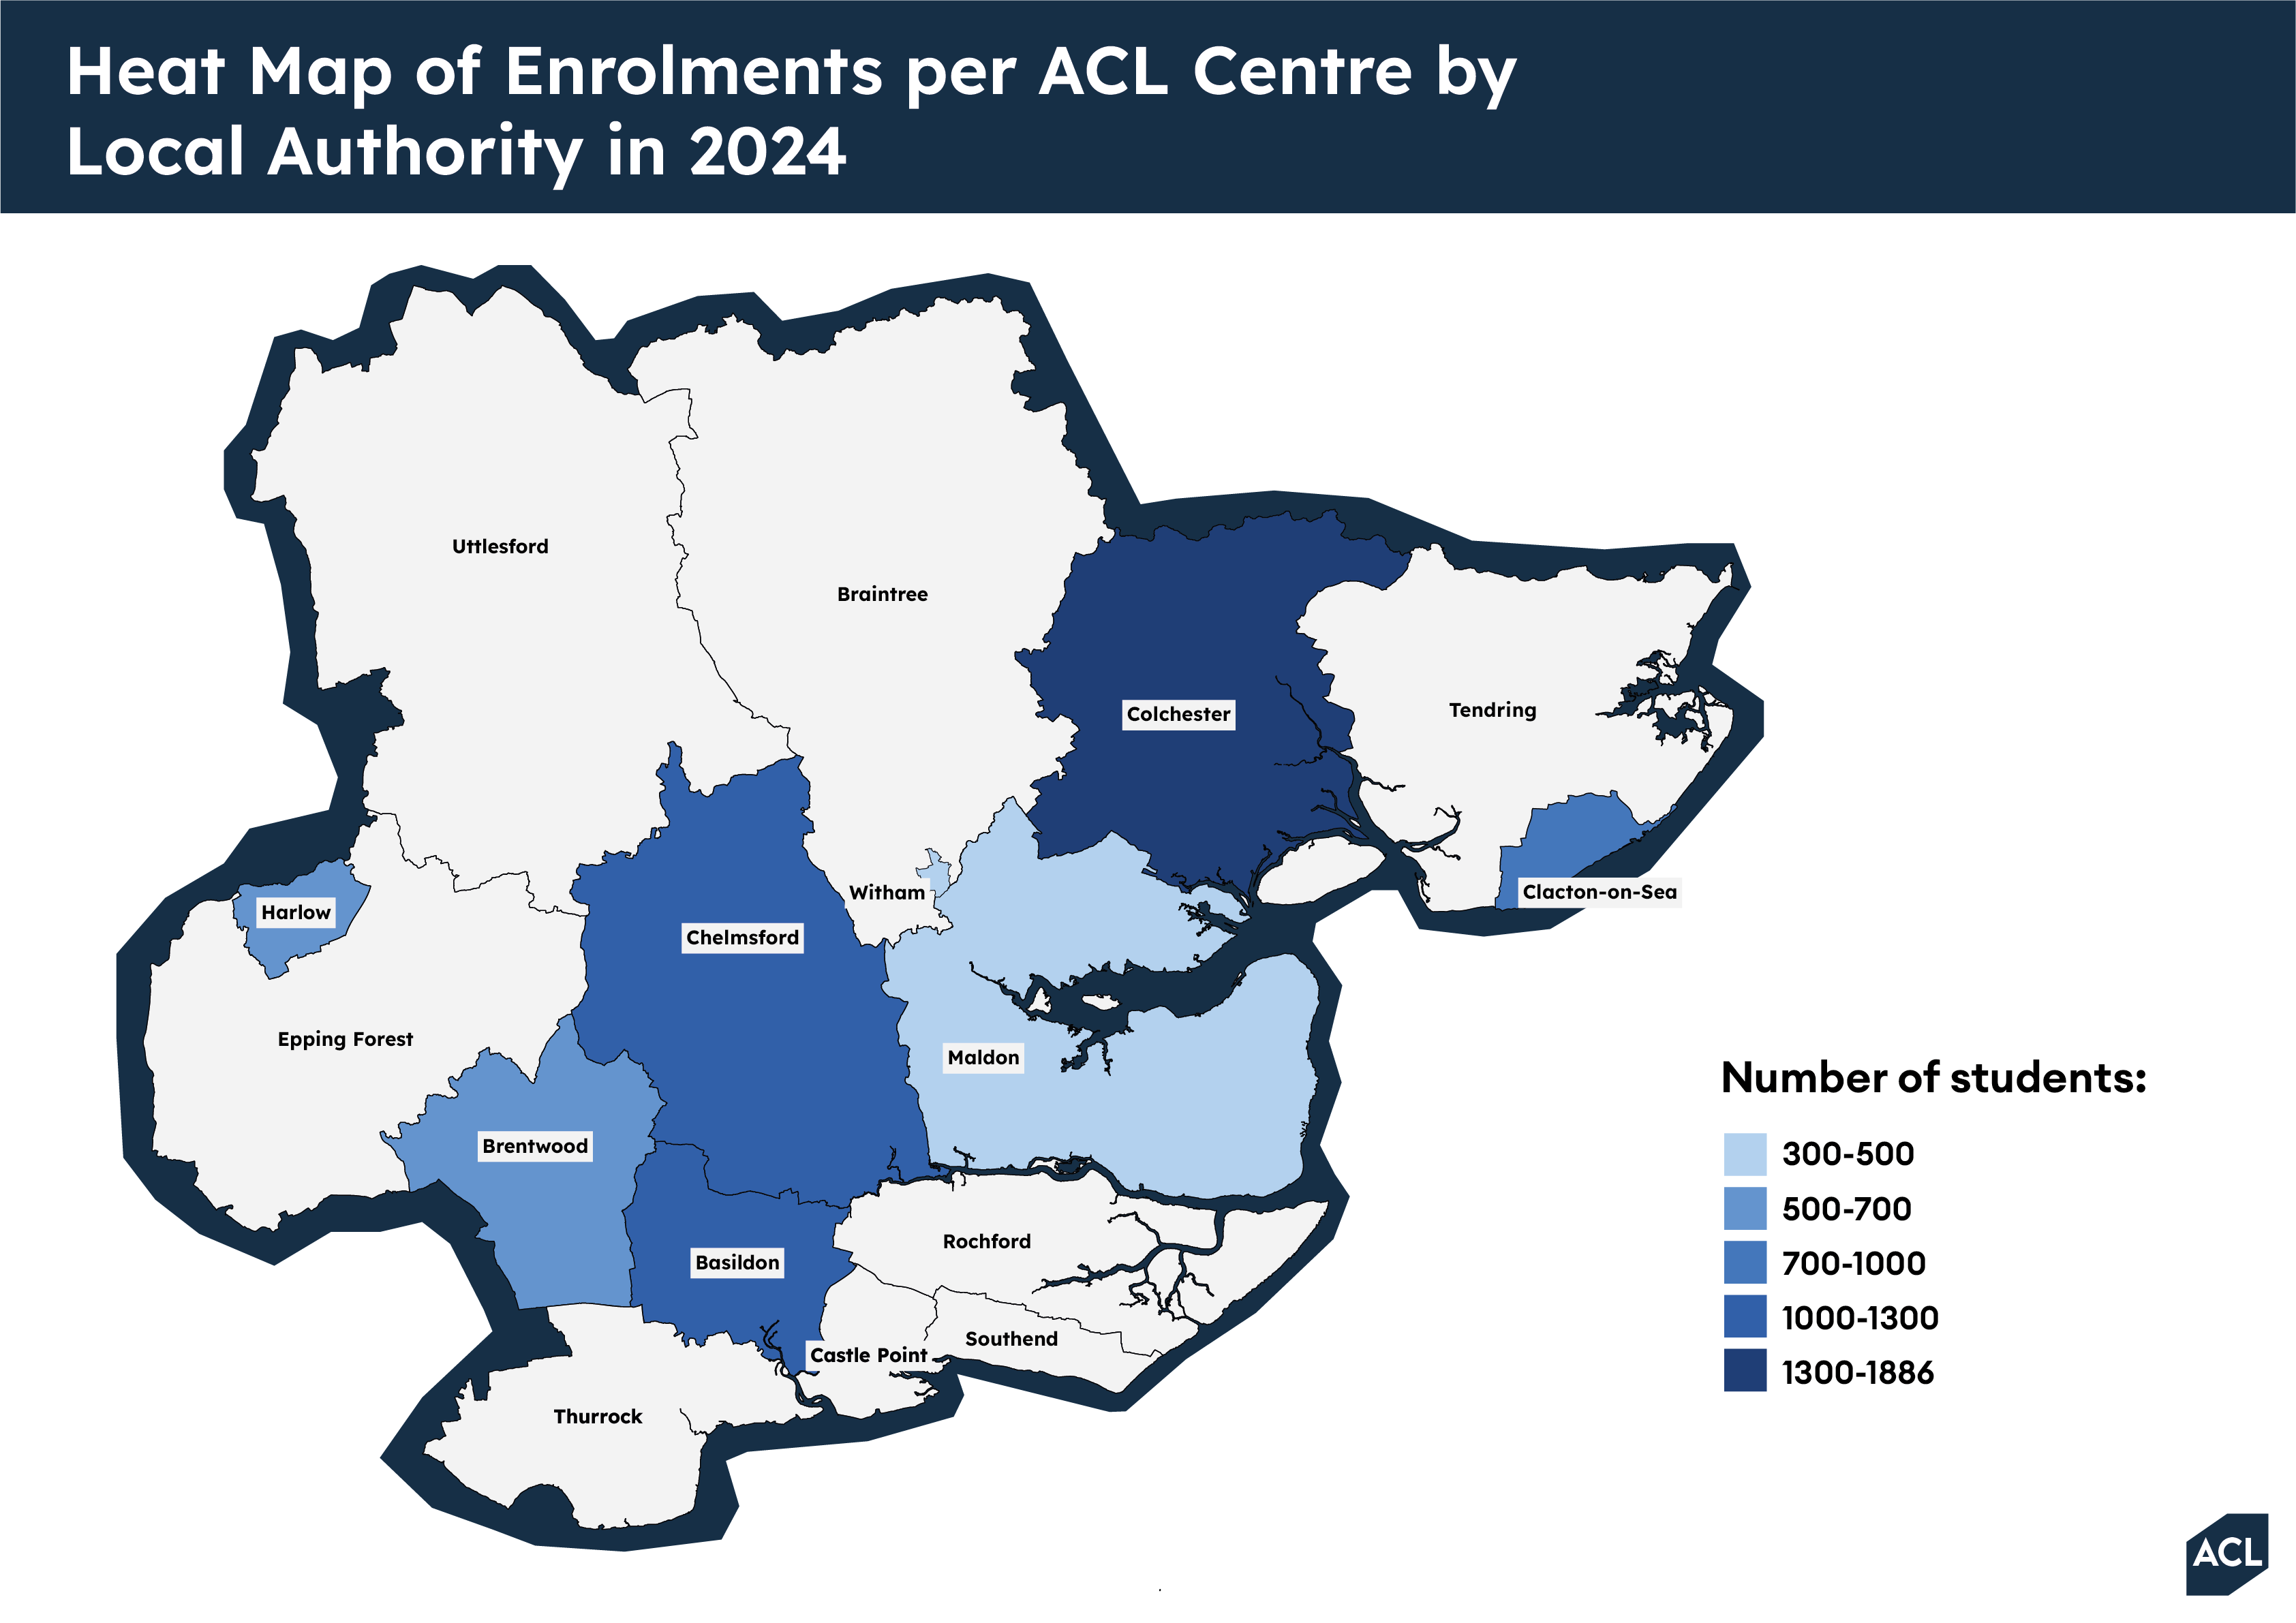
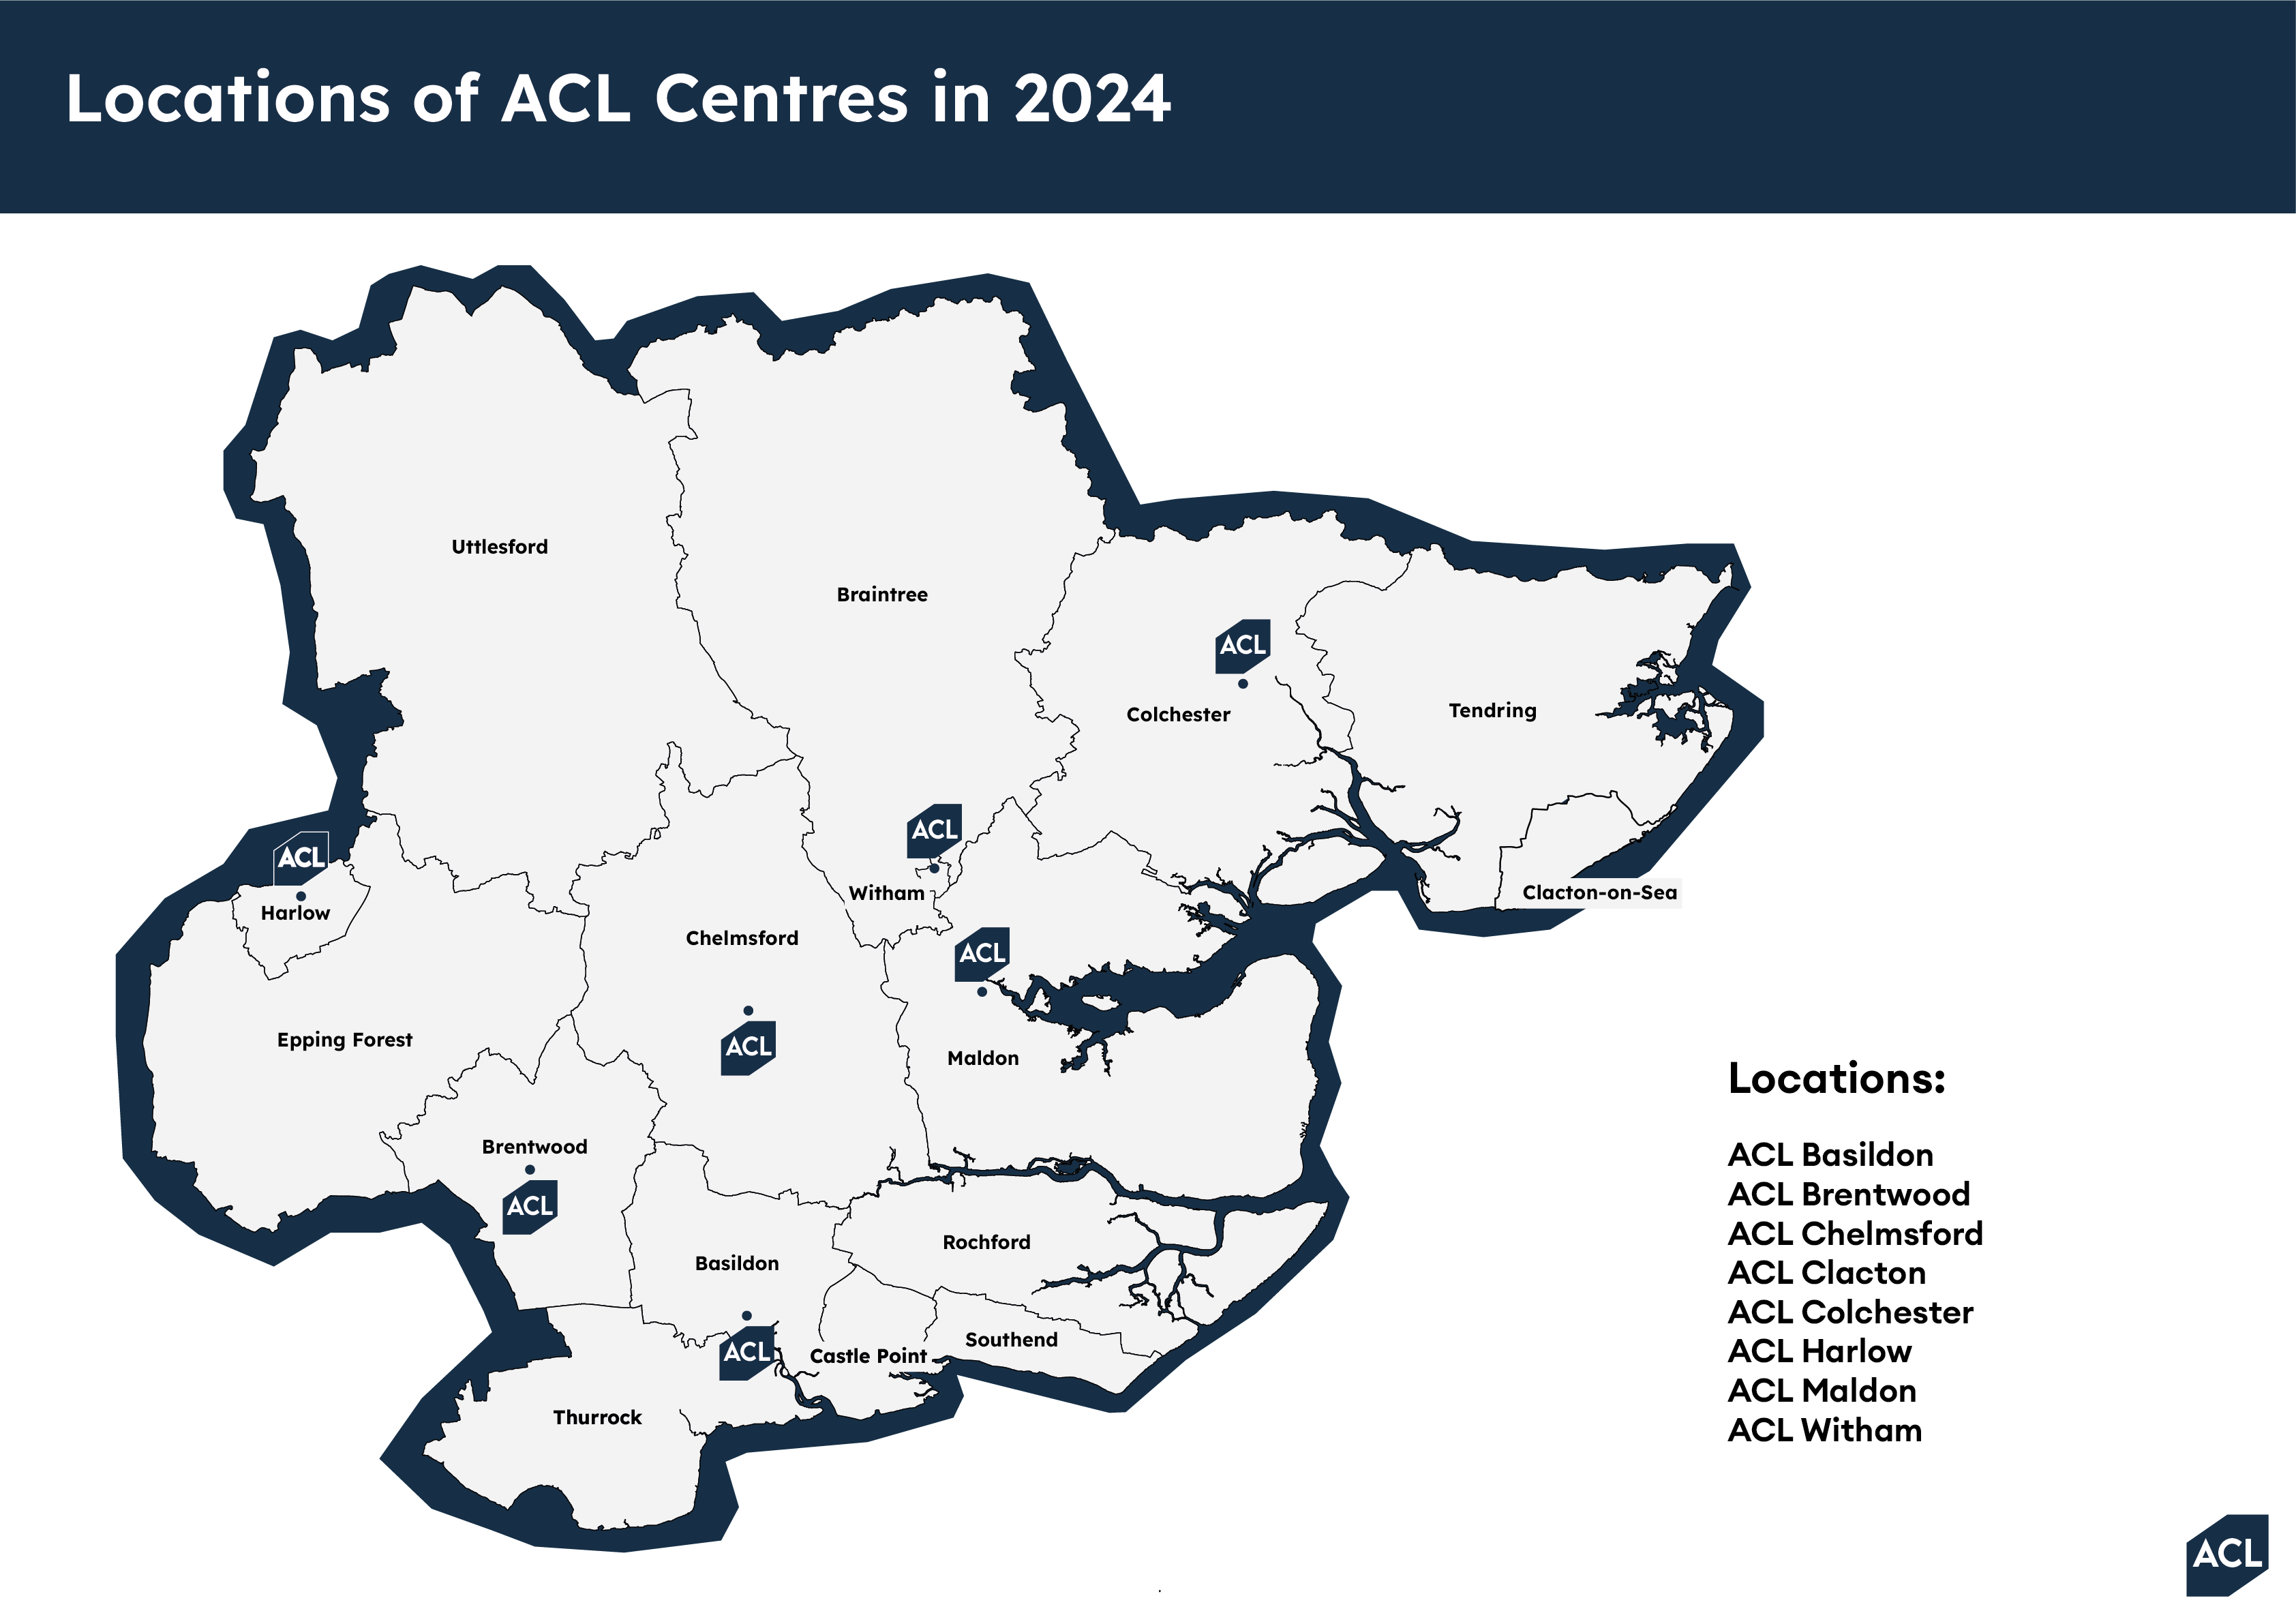
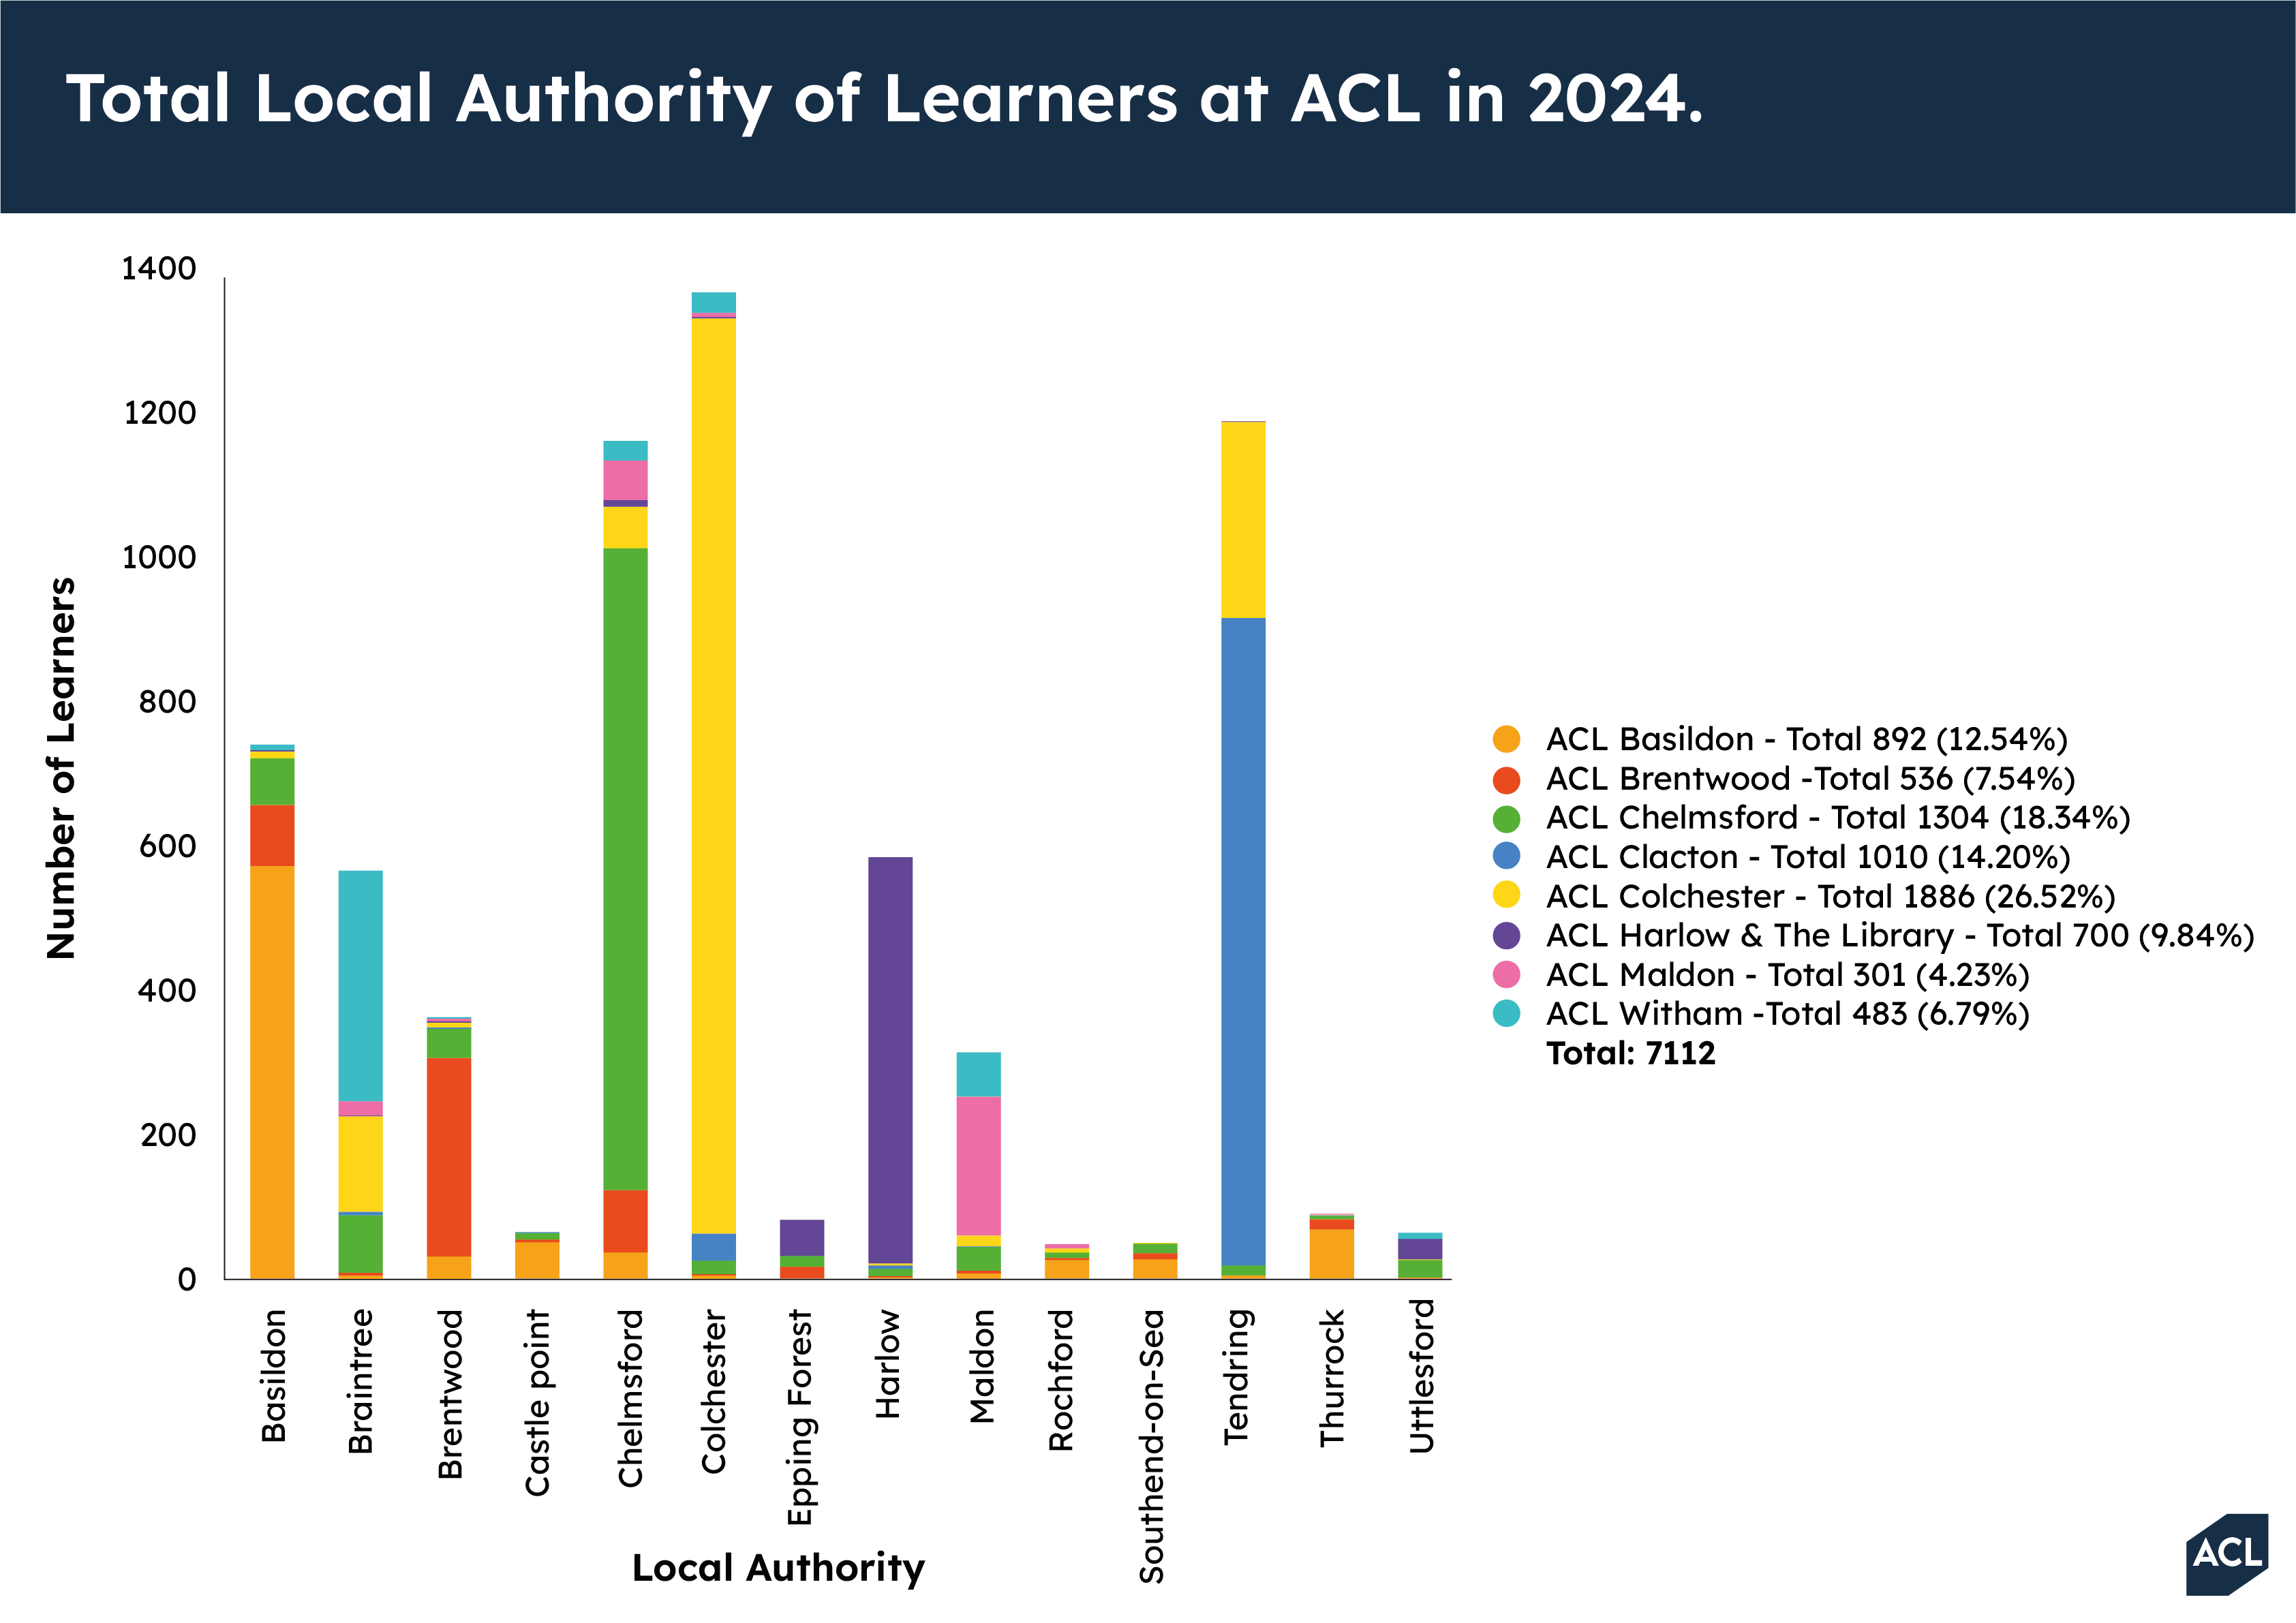
For ACL Essex, I designed infographics and regional maps to visualise key learner data across seven delivery centres. Data categories included employment status, Universal Credit enrolment, ethnicity, and geographic spread.
Each piece was structured to support comparison across centres while remaining accessible to a wide audience. Design choices: like pie chart structures, accessible typography, and heat maps, helped surface trends quickly while maintaining alignment with ACL’s visual identity.
This project highlighted my strength in distilling large, multi-centre datasets into intuitive, high-utility visuals.
I was commissioned to design a series of infographics for ACL Essex, aimed at presenting key learner data across multiple delivery centres in a clear and accessible format. The work involved visualising complex internal data sets relating to benefit status, employment status, ethnicity, and geographic distribution of learners during 2024.
For ACL Essex, I designed infographics and regional maps to visualise key learner data across seven delivery centres. Data categories included employment status, Universal Credit enrolment, ethnicity, and geographic spread.
Each piece was structured to support comparison across centres while remaining accessible to a wide audience. Design choices: like pie chart structures, accessible typography, and heat maps, helped surface trends quickly while maintaining alignment with ACL’s visual identity.
This project highlighted my strength in distilling large, multi-centre datasets into intuitive, high-utility visuals.